Thanks to the GIMS project, a deep-seated landslide in the north of Slovenia (Alpine region) has been equipped with 7 GNSS units to monitor surface displacements. In this article we want to present the latest results obtained after more than one year of ongoing monitoring, taking into consideration data gathered over a semester, from October 2019 to April 2020.

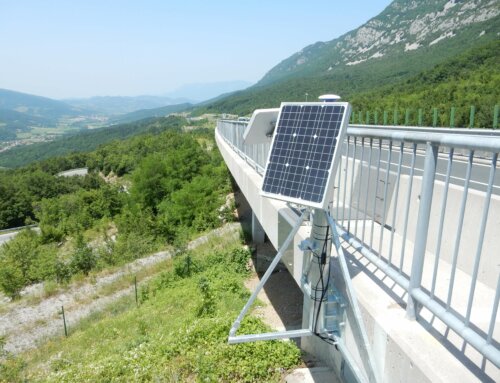
Figure 1: Monitoring network.
A unit (number 5 in Fig.1), that was placed on a large boulder in the lower funnel-like part of the landslide, showed the highest surface displacements during the observation period.
It monitors the displacement of the mixed weathered clastic rocks and carbonate talus deposits in the lowest part of the landslide.

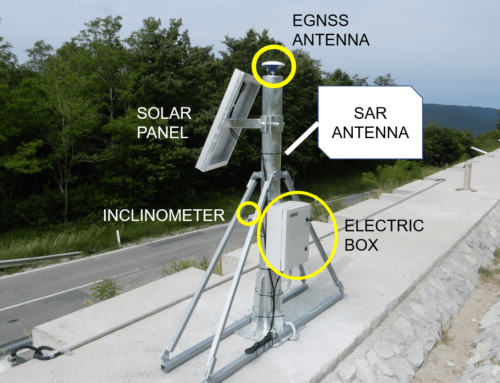
Figure 2: Unit 5 at the funnel-like lower part of the landslide is installed on a large boulder.
Results
The unit has measured the following 3D displacement over 6 months, from October 2019 to April 2020.

Figure 3: GNSS-measured 3D displacement at unit 5.
| POTOŠKA PLANINA
24.10.2019-20.04.2020 |
Total displacement of UNIT 5 (mm) |
|
Measured total 3D displacement (mm) |
284.09 |
| Modelled total 3D displacement (mm) | 285.68 |
The measurements are being correlated with two parallel monitoring techniques: wire crackmeter and classic geodetic measurements (see Fig.1 for locations).
The wire crackmeter is located 50 m NNW from the GNSS unit (Fig. 1). It measures the lateral displacement of the anchor anchored into the landslide body (Fig. 5). The opposite, GNSS measures the displacement of unconsolidated material in the lowest part of the landslide (Fig. 5). For this reason, measured total displacements are considerably different. However, the pattern of landslide movement is well comparable (Fig. 4):

Figure 4: Correlation between wire crackmeter and GNSS measurements.

Figure 5: Different direction of measured displacements.
Wire crackmeter measured lateral displacement while GNSS measured the displacement in the central part.
Gnss vs. Classic geodetic measurements
Geodetic points are distributed across the landslide area, but do not spatially coincide with any of GNSS unit. Therefore, we correlated the closest geodetic and GNSS points located in areas of equivalent kinematic characteristics. Unfortunately, there is no nearby point close to unit 5, thus The plots show correlation for GNSS units other than unit 5.
Measured total horizontal displacements for the period between 3.1.2020 and 17.4.2020 is well comparable. Correlation between datasets considering vertical displacement is weaker due to the lower resolution of both methods.
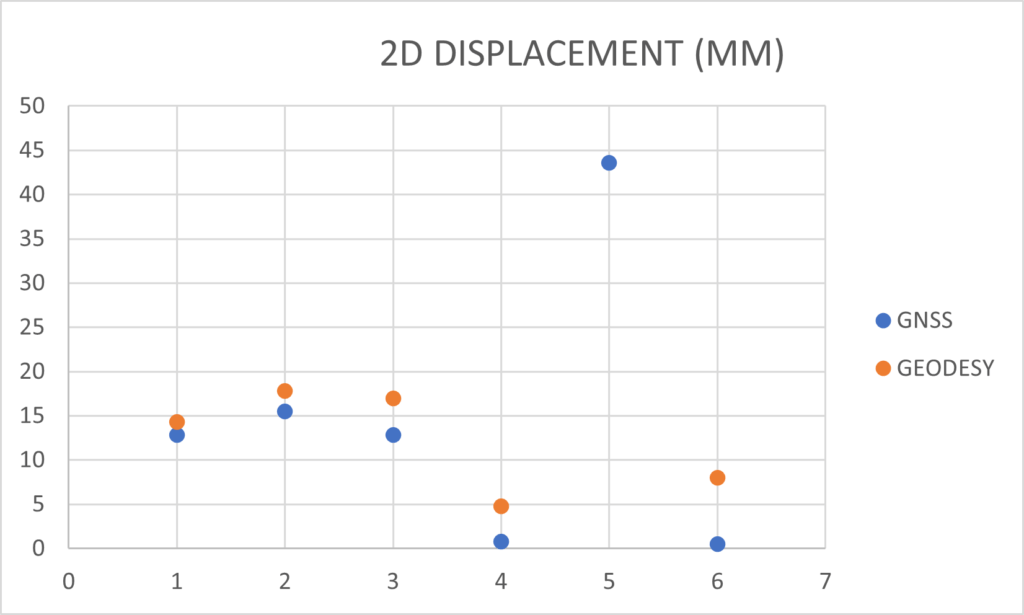

Figure 6: Correlation between geodetic and GNSS measurements.
During the observation period, we encountered rainy, dry and mixed periods and 3 rain events. At all 3 rain events, GNSS units evidenced an increased trend of surface displacement. Figure 7 shows an example of the increased surface displacement at the GNSS unit 5, measured during the third rain event.

Fig 7: Recorded increased rate of the displacement during the 3rd rain event.
To determine how the rainfall influences the surface displacements in the lowest part of a deep-seated landslide, we correlated the precipitation data acquired at the site with the surface displacement data measured at the GNSS unit 5. The correlation coefficient between the antecedent precipitation and daily displacement was the highest when considering 17 days of antecedent precipitation (r = 0.89).
Acquired information based on a rather short dataset indicates that the displacements at the lowest part of the landslide reflect combined shallow and deep processes. Quick response to the precipitations as visible from Fig. 7 is associated to surface sliding processes, while the best correlation between precipitation and displacement established for a considerably longer period (17 days antecedent precipitation) indicates parallelly active deeper processes responsible for the displacement of the entire landslide body at this site. With further GNSS data collection, we expect to acquire more accurate information on the landslide kinematics and other data that will help us predict landslide behaviour.

Fig. 8: Linear correlation established between the 17-days antecedent precipitation and daily displacement at the GNSS unit 5.